
In today’s fast-paced business environment, understanding key numbers is essential. I rely on various financial metrics to navigate my company’s direction effectively. These quantitative measures come from balance sheets, income statements, and cash flow statements. By focusing on core metrics like revenue, net profit, and net burn, I can assess whether my company is growing or facing challenges.
These metrics provide a clear picture of my company’s health. They help me connect raw data with crucial aspects like profitability and liquidity. By analyzing these indicators over time, I can make informed decisions that support sustainable growth. It’s not just about one reporting period; it’s about the trends that emerge.
As we look toward the future, the importance of tracking these financial KPIs will only increase. In 2026 and beyond, staying informed will be key to navigating the complexities of business.
Key Takeaways
- Financial metrics are essential for evaluating company health.
- Core numbers like revenue and net profit indicate growth and sustainability.
- Analyzing KPIs helps connect data with profitability and liquidity.
- Consistent tracking over time is crucial for informed decision-making.
- Future business success relies on understanding these key indicators.
Introduction to My Approach on Financial Decision-Making
To steer my company in the right direction, I focus on the most important performance indicators. Tracking key performance indicators (KPIs) helps transform overwhelming data into actionable insights. This process is essential for making informed decisions that drive growth.
Understanding trends across monthly, quarterly, and annual periods is crucial. These insights reveal whether specific initiatives or departments are enhancing performance or introducing risks. In fact, with tools like Fathom, I can access over 50 built-in KPIs, allowing for customized metric tracking.
However, I recommend focusing on a select few indicators rather than getting lost in excessive reporting. Each KPI should connect to measurable business objectives, helping to distinguish valuable insights from mere numbers.
| KPI Type | Purpose | Frequency |
|---|---|---|
| Revenue Growth | Measures sales increase | Monthly |
| Net Profit Margin | Assesses profitability | Quarterly |
| Cash Flow | Tracks liquidity | Monthly |
Key Financial Metrics for Better Decision Making
Understanding the core numbers behind revenue and profit is vital for any business. Revenue is the income generated through primary operations, often referred to as the top line. On the other hand, net profit is the amount remaining after all expenses are subtracted, commonly known as the bottom line.
To assess company health, I focus on three essential measures: revenue, net profit, and net burn. The revenue growth rate, which measures the percentage increase or decrease between two periods, should be compared over time. This approach helps avoid misinterpretations based on a single month’s data.
Additionally, I connect sales activity with revenue performance. This connection allows me to identify which products or strategies truly drive growth. Understanding net profit reveals the cash left after deducting operating expenses, interest, and taxes. These insights help distinguish between companies growing quickly and those achieving sustainable profitability.
| Metric | Description | Importance |
|---|---|---|
| Revenue | Income from primary operations | Indicates overall business performance |
| Net Profit | Remaining income after expenses | Shows profitability |
| Revenue Growth Rate | Percentage change over periods | Measures growth trends |
Profitability Measures and Their Impact
Grasping the nuances of profit margins is essential for effective decision-making. Understanding both gross profit margin and net profit margin helps me evaluate my company’s performance. The gross profit margin is calculated by dividing gross profit by revenue and multiplying by 100. This measure indicates how efficiently a company produces its goods.
On the other hand, the net profit margin shows how much revenue remains after all expenses, including interest and taxes, are deducted. I find this ratio invaluable for assessing overall profitability. It highlights the bottom line and helps me identify areas for improvement.
Additionally, I leverage return on investment (ROI) to gauge the effectiveness of my expenditures. ROI is calculated by taking the net profit from an investment, subtracting its cost, and dividing by the investment cost, then multiplying by 100. This metric allows me to prioritize projects that yield the highest returns.
| Measure | Calculation | Purpose |
|---|---|---|
| Gross Profit Margin | (Gross Profit / Revenue) x 100 | Efficiency in production |
| Net Profit Margin | (Net Income / Revenue) x 100 | Overall profitability |
| Return on Investment (ROI) | ((Net Profit – Cost) / Cost) x 100 | Investment effectiveness |
Liquidity Measurements for Short-Term Stability
In the realm of business, understanding liquidity is crucial for maintaining stability. Liquidity measures how easily a company can meet its short-term obligations. Two key ratios that help assess this are the current ratio and the quick ratio.
The current ratio is calculated by dividing total current assets by total current liabilities. A current ratio of 2 or more generally indicates a stronger short-term financial position. This ratio shows whether a business can cover its short-term debts using its current assets.
On the other hand, the quick ratio focuses on the most liquid assets. It includes cash, cash equivalents, and accounts receivable, divided by total current liabilities. A quick ratio of 1:1 or higher is often considered safe, especially when a company cannot rely on inventory sales.
It’s essential to interpret these ratios alongside cash flow and collection timing. A ratio alone does not guarantee financial stability; understanding the context is vital.
| Ratio | Calculation | Indication |
|---|---|---|
| Current Ratio | Total Current Assets / Total Current Liabilities | Ability to meet short-term obligations |
| Quick Ratio | (Cash + Accounts Receivable) / Total Current Liabilities | Immediate liquidity without inventory |
| Safe Level | N/A | Current Ratio ≥ 2, Quick Ratio ≥ 1 |
Efficiency Ratios to Optimize Business Operations
To enhance operational efficiency, I closely monitor key efficiency ratios. These ratios provide insights into how well my company manages its resources. Two important measures are inventory turnover and accounts receivable turnover.
Inventory turnover is calculated by dividing the cost of goods sold by the average inventory balance for the period. This ratio helps me evaluate how frequently inventory is sold or replaced. A lower turnover can indicate excessive purchasing or slow-moving stock, which ties up cash.
On the other hand, accounts receivable turnover equals sales on account divided by the average accounts receivable balance. This ratio indicates how quickly customers pay their invoices. A higher turnover suggests effective collection policies and improved cash flow.
Connecting inventory and receivables with cash flow is crucial. Both directly influence how quickly operating activity translates into available cash. I also compare these efficiency ratios by period and industry to benchmark performance effectively.
Solvency and Growth: Assessing Long-Term Financial Health
Evaluating the long-term health of my company requires a focus on solvency and growth. Two critical ratios help me understand this aspect: the debt-to-equity ratio and interest coverage. These ratios provide insights into how my company finances its operations and manages its debt.
The debt-to-equity ratio is calculated by dividing total debt by total equity, then multiplying by 100. This ratio reveals how much of my company’s assets are financed through borrowing versus owner-supplied equity. A higher ratio may indicate increased risk, while a lower ratio suggests more stability.
Next, I assess interest coverage by comparing earnings before interest and tax with interest expenses. This measure shows my company’s ability to service its debt. A strong interest coverage ratio indicates that my earnings can comfortably cover interest payments, which is vital for long-term sustainability.
Additionally, I analyze the revenue growth rate alongside EBITDA to differentiate between growth in sales and improvements in core operations. This comprehensive view allows me to make informed decisions about investments and operational strategies.
Finally, I always compare these solvency measures with industry standards. This context helps me understand how my company stacks up against competitors and ensures that my capital structure aligns with industry norms.
Real-Life Examples: Turning Data into Action
Turning insights from data into strategic actions is vital for business success. A great example is the London-based digital agency, Matter of Form. Under the leadership of COO Fred Moore, the agency used financial KPIs to bridge the gap between creative and financial cultures.
Matter of Form identified 15 monthly goals, categorizing them into five financial, five sales, and five operational KPIs. This organization helped streamline their focus and drive results.
By utilizing a focused dashboard, they connected profitability, efficiency, cash flow, and growth. This integration allowed for better team alignment and performance tracking.
Key lessons from Matter of Form include:
- Metrics become more impactful when employees understand their role in company performance.
- Setting clear targets and importance levels turns data into actionable insights.
- Alerts on performance help teams respond quickly to changes.
For more insights on creating effective business strategies, check out this guide on how to make an eCommerce website.
| KPI Type | Purpose | Impact |
|---|---|---|
| Financial KPIs | Track profitability | Aligns team goals |
| Sales KPIs | Measure sales performance | Drives revenue growth |
| Operational KPIs | Evaluate efficiency | Improves operations |
Tools and Dashboards to Track Financial KPIs
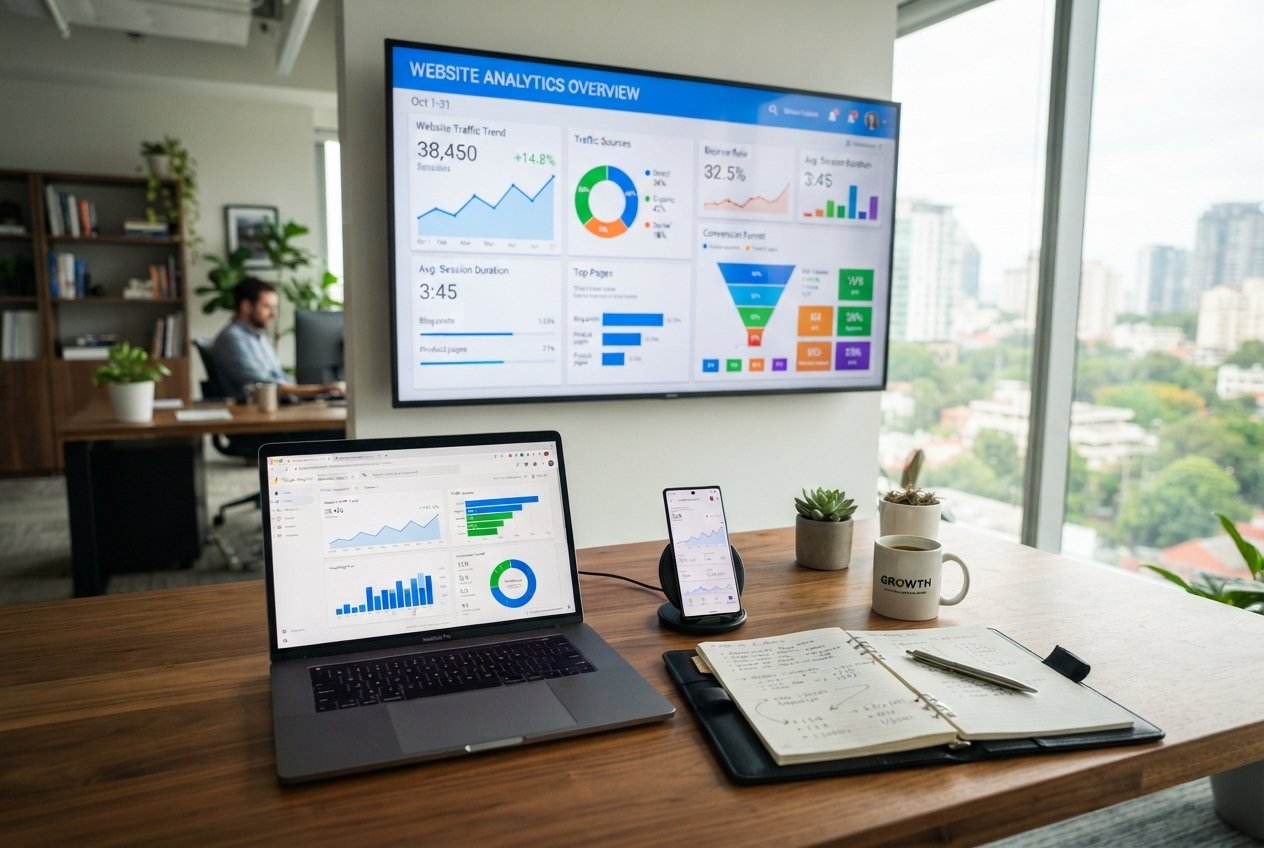
Utilizing modern dashboards can transform how I analyze my company’s performance. These tools streamline the tracking of key performance indicators, making it easier to monitor growth and profitability.
For instance, Fathom integrates seamlessly with accounting software like Xero, QuickBooks, and MYOB. This integration supports daily syncing of data, ensuring that I always have the latest information at my fingertips. Fathom also offers over 50 built-in KPIs, scorecards, and target monitoring features.
On the other hand, ThoughtSpot provides Liveboards, which are real-time, interactive data visualizations. Companies like PetsMart and Snowflake use these tools to gain insights into their performance. These dashboards allow me to visualize data in a way that enhances decision-making.
Additionally, the Australian Taxation Office offers benchmarks that can add context when evaluating a company’s ratios and margins. This external perspective is invaluable for assessing performance against industry standards.
| Tool | Features | Benefits |
|---|---|---|
| Fathom | Daily syncing, KPI scorecards | Real-time performance tracking |
| ThoughtSpot | Liveboards for data visualization | Interactive insights for decision-making |
| ATO Benchmarks | Financial ratios and industry standards | Contextual evaluation of performance |
Challenges and Pitfalls in Financial KPI Management
Navigating the complexities of KPI management can be a challenging endeavor for any business. One key issue is the overwhelming number of indicators. Businesses are advised to track between four and ten KPIs. This focus helps preserve clarity and avoids confusion among employees.
Unrealistic targets can also demotivate teams. When goals ignore historical performance or market conditions, they create a culture of failure. It’s essential to set achievable KPI targets that reflect industry benchmarks.
Regular reviews of KPIs are crucial. They should account for changes in business strategy, sales channels, and operating conditions. Outdated KPIs can lead to poor decision-making and misinterpretations of cash flow and profitability.
Moreover, data quality plays a significant role. Inaccurate accounts can produce misleading ratios and margins, affecting growth conclusions. Emphasizing employee buy-in is vital. Feedback from teams and managers ensures that KPI definitions remain practical and relevant.
| Challenge | Impact | Solution |
|---|---|---|
| Overwhelming KPIs | Confusion among employees | Limit to 4-10 KPIs |
| Unrealistic Targets | Demotivated teams | Set achievable goals |
| Outdated KPIs | Poor decision-making | Regular reviews |
Conclusion
I use revenue, net profit, cash flow, and net burn as a clear starting point for reading my company’s direction. Together, these numbers show whether sales support growth, cash needs attention, or expenses are outpacing income.
I review profitability, liquidity, efficiency, solvency, and growth as one picture. The current ratio, debt-to-equity ratio, inventory turnover, and accounts receivable turnover add useful context. No single ratio tells the whole story, so I compare past periods with industry norms before changing a plan.
In 2026, focused KPIs, reliable data, and a simple dashboard help me act at the right time. I check cash flow, margin, and operating performance on a set schedule, then assign clear next steps. My best decisions come from trends I can explain and actions my team can take.